5.1.6 on Arch/Manjaro (installed via Pacman)
I’m trying to render a complete representation of the whole family. It has ~650 people. For this test, I cleared all databases and did a new import from a RootsMagic 9 GEDCOM file.
Some of the partial-type charts work, but Family Lines Graph (to SVG) pops-up with a message saying “You did not specify anybody” (I tried naively selecting one person or many people but it made no difference) and the Relationship Graph (to PDF, SVG) always just freezes. No verbosity is printed to the terminal after requesting the Relationship Graph and then I gave it a couple of hours, but it never completes. The file initial creates with a couple of kilobytes but then never changes.
The Hourglass Graph works (in that it renders something completely, but is not something I can use or spend time on).
Thoughts? Based on the forums, it seems like there are a few users that have used the Relationships Graph for large families, so I’m not sure if there was a bug introduced in a recent Gramps version.
Try generating the report with the output format set to “Graphviz File”. This will give you an indication of where it is failing.
Meaming that I should be looking for verbosity/progress… in the console?
I have Graphviz installed, but does Gramps require any additional dependencies?
The graph reports run in two stages: first they generate a graphviz file and then run dot to render the graph.
I’d like to know where it is freezing. If you can get a graphviz file, then you could run dot from the command line.
Neither showed up. Doesn’t seem to leave us a clear path forward.
Dustin
Also, I have another instance of Gramps (AIO64-5.1.6-1) running on a remote copy of Windows Server 2019 (alongside installations of RootsMagic 8 and 9). That copy of Gramps’ Relationship Graph renders DOT data just fine. However, I’m finding it queer that “Gramps ID” is set to “Do not include” and “Show all family nodes” is unchecked but they appear to be showing up in the output, anyway.
Relevant settings:
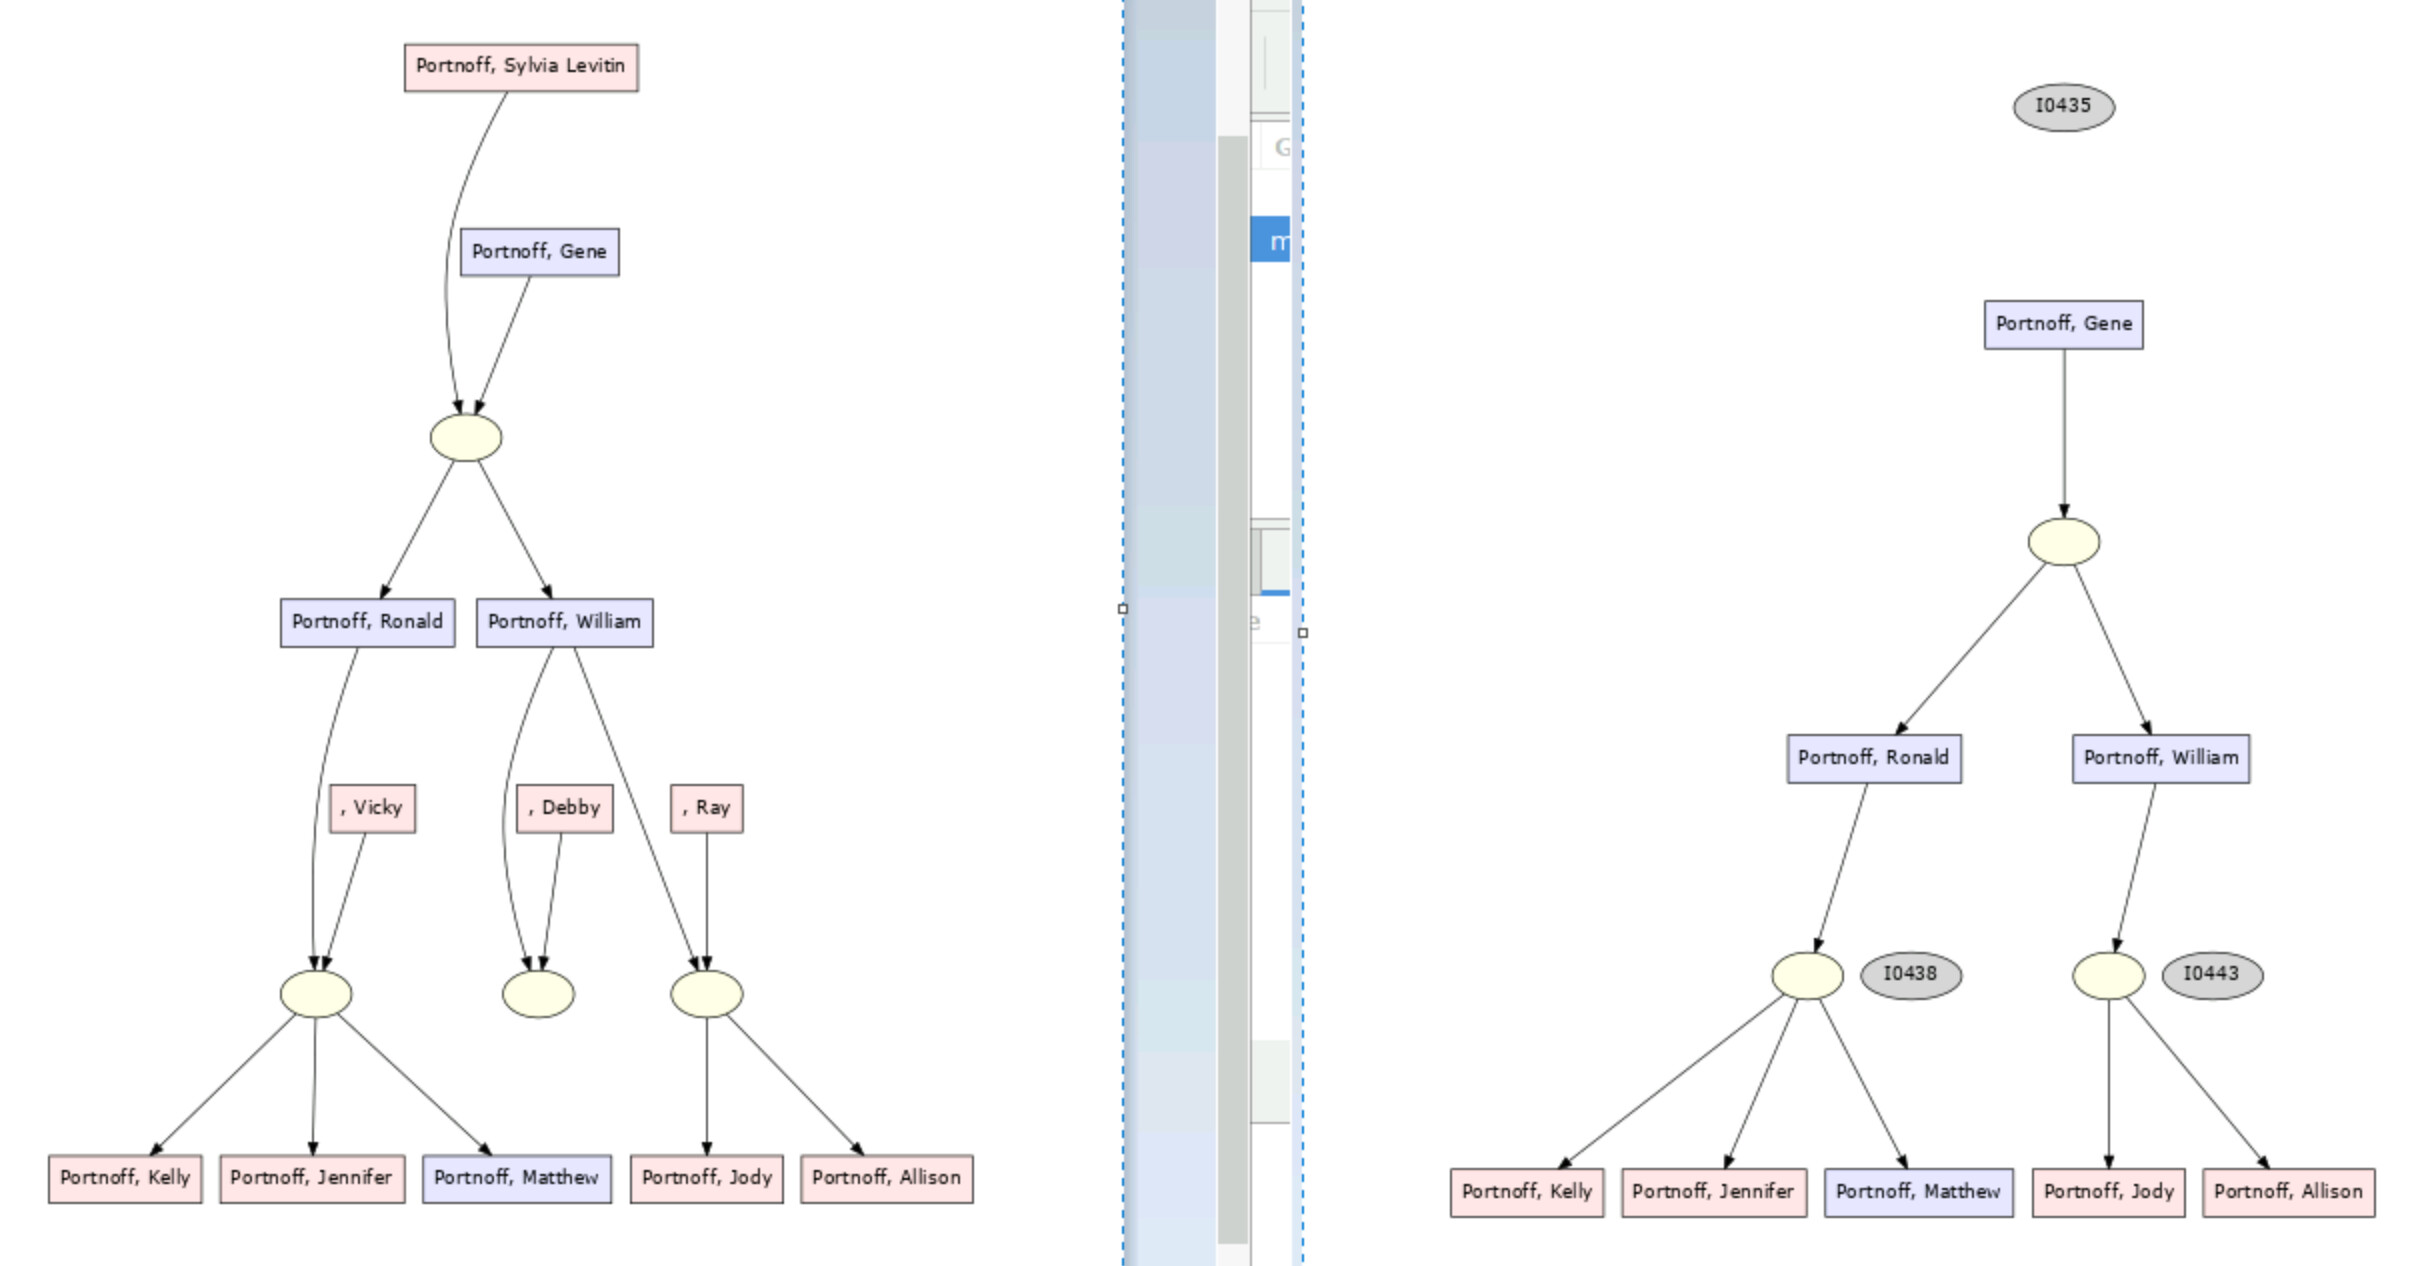
Output (PNGs via neato):
I’m assuming the “family nodes” are the yellow ovals. Any idea why this isn’t working, or if there’s a better (but still simple) way to remove the IDs and family nodes?
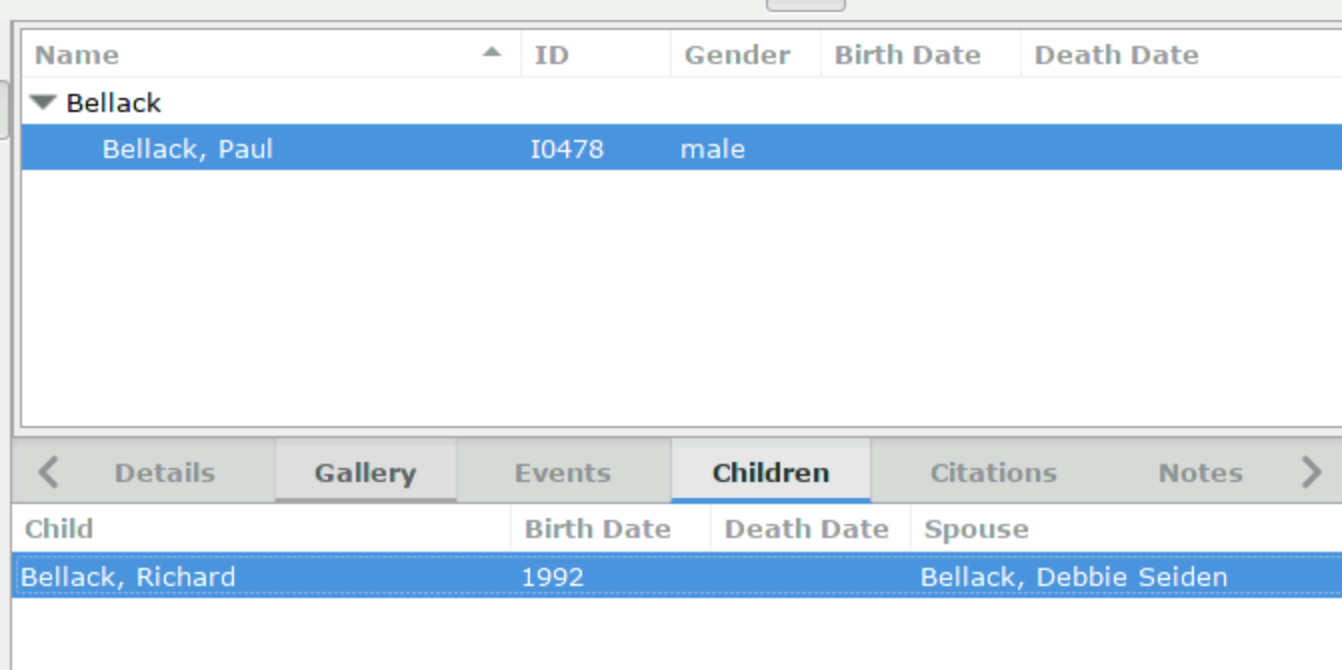
Could you identify individual I0647?
It helps if we have some understanding of the underlying data. (Which is why the Example.gramps data is used for all the illustration in the wiki. And preferred for illustrating bug reports and feature requests.)
Try running:
Tools → Utilities → Find database loop…
Perhaps the code that generates the report is stuck in an infinite loop.
Okay. Somehow that instance, directly imported from a GED, had a loop/cycle. When I recreated it, no loop was present, so maybe I inadvertently screwed-up the data.
Those IDs look like they are spouses, but it’s unclear why they’re represented that way.
Example 1:

Example 2:
It looks like that’s the difference between “descendant” and “descendant family” charts. You’re probably familiar with it, it just wasn’t obvious from such a dense graph.
Do you know if we can render without those weird spouse orphans in the non-family descendant chart? What about those “family” nodes? They’re specifically unchecked. I’d expect a much simpler graph where only related descendants are present (with children connected directly to the parent).
Looks like you’ve isolated where the bug comes from. It’s the spouse section putting in completely wrong structures.
The next step is to isolate whether it does that with good data (such as with data from example.gramps ) or if your GEDCOM was output from RootsMagic with corrupt Spouse data.