Hi,
I’ve been making a little Gramps Web exporter using API documentation I found here: Swagger UI
Wondering if GrampsWeb has the option to have a metrics endpoint enabled for prometheus to scrape so I can view the details within grafana. This would remove the need for my exporter but simplify the overall workflow. I can’t find any documentation on this other than the telemetry data sent once a day.
A little bug perhaps, the get metadata API call does not return the Gramps Web Frontend version number. Is this value stored/returned elsewhere?
Thanks!
Malakan
Mind sharing it?
No. In my view this should be handled outside of Gramps Web API.
Not a bug. The Web API can be used without a frontend, or even with different versions of the frontend. So it doesn’t know the frontend version.
The frontend exposes its own version in the `grampsjs-sysinfo` component.
Appologies for the delay, this is my first time building and sharing an image, had to setup some things.
Here’s my first iteration:
docker pull ghcr.io/supermalakan/grampsweb_exporter:latest
services:
  grampsweb_exporter:
    image: ghcr.io/supermalakan/grampsweb_exporter:latest
    container_name: grampsweb_exporter
    restart: unless-stopped
    ports:
      - "8000:8000"
    environment:
      GRAMPSWEB_URL: “https://demo.grampsweb.org/” # Change to your Gramps Web URL
      GRAMPSWEB_USER: “owner” # Change to your Gramps Web username
      GRAMPSWEB_PASS: “owner” # Change to your Gramps Web password
      SCRAPE_INTERVAL: 120 # Scrape interval in seconds (default: 120)
I was going to put in the grampsweb demo details into the readme, if that’s fine with you?
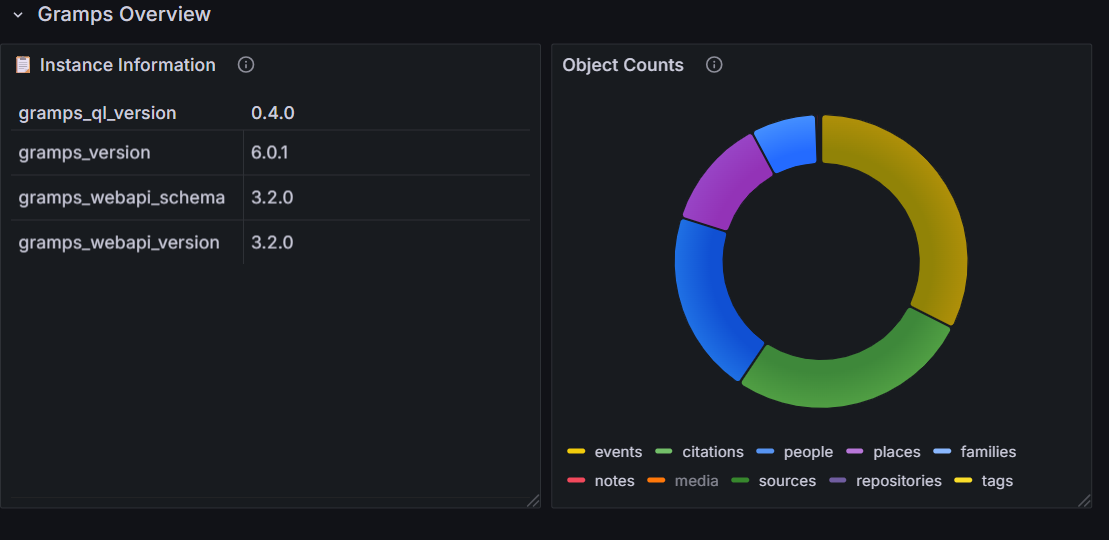
The only thing this scrapes so far is from the metadata API call: gramps.version, gramps_ql.version, gramps_webapi.version, gramps_webapi.schema and finally object_counts.
If there any other metrics you would like, let me know! Feedback welcome!
Grafana showing the scraped data
1 Like