It would be interesting to plot event clusters for a family or ancestors or descendants or just a filter match result in form of a hotspot heatmap. Currently in the map view category the views only show markers for the events, but not the density of the event clusters. I think it would allow new and interesting ways to represent areas of interest or event clusters.
Sample picture of what I mean with a hotspot heatmap:
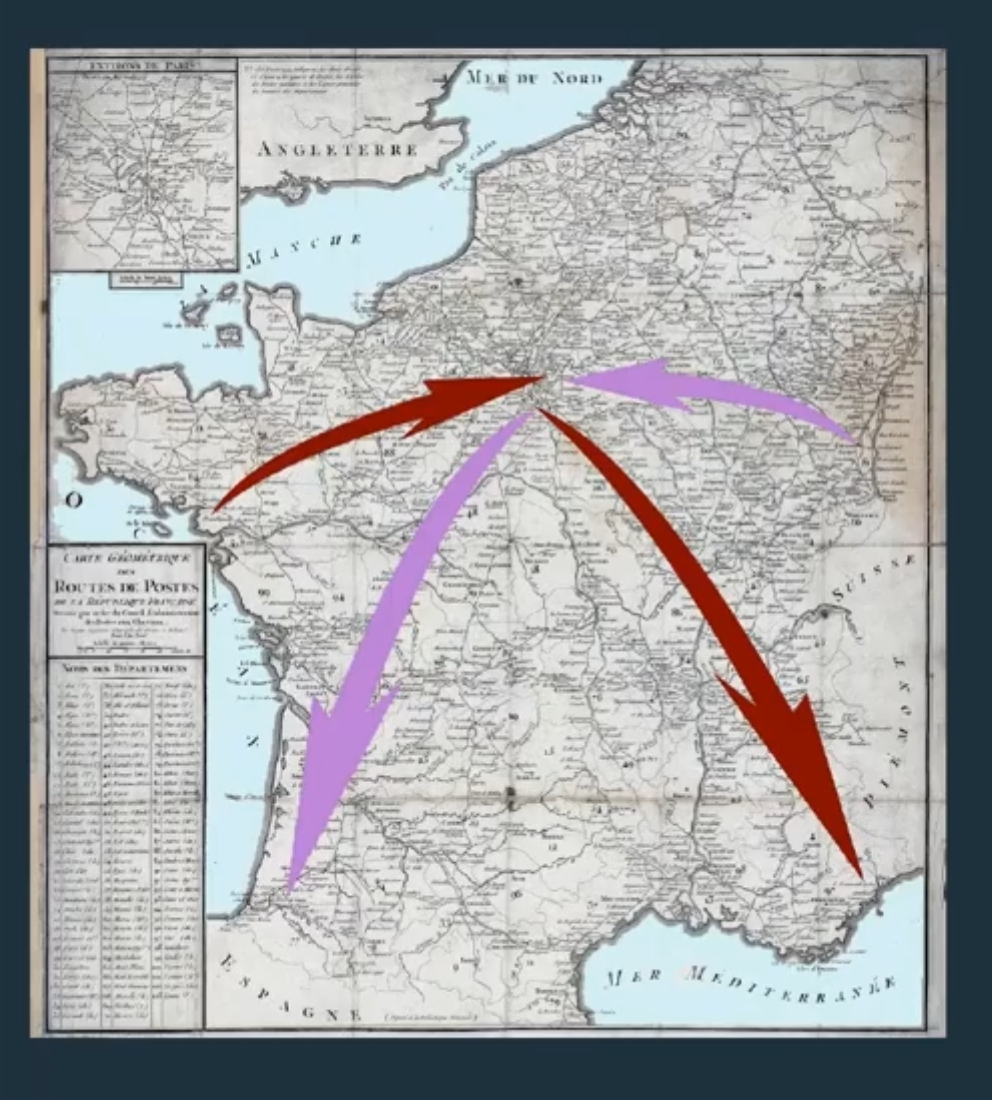
It links ancient family event clusters to current clusters (industrial migration from countries to cities) viewing this only using big arrows between clusters (time logic).
Yes a combination of a heatmap and arrows added with GIMP/Photoshop would be a nice way to explain movements. I have researched some lines where I have already found most or all descendants.
Well I meant is it reasonable possible to create for Gramps? I don’t know which libraries could be used for that or already being used and would allow that. Like if everything would have to be created from scratch, it’s probably a better idea to create some export and use an external program, since nice maps are cool, but not the main focus of Gramps.
The folium package is great, but I recognized a problem with the heat maps: They only show the density of places, not the density of the events. I tried to change the weight for the places depending on the number of events, but it seems to have no to very little effect.
I afraid I probably need chloropleth maps with devision on municipal or parish level to create what I was looking for, but it is much more difficult to get geodata for them as well as exporting the event places from my place hierarchy instead of using the coordinates.
My current workaround is using circle markers colored depending on the number of events.
@PLegoux thanks for sharing. I love this feature from Geneanet and it is more or less the same what I’m trying to do, but I use ancestor and descendants branches instead of surname maps. The python package “folium” is also using leaflet for the heatmap generation.
Previous interface much precise: Sorry, I don’t remember it. After, by nature, a hotspot is not as precise as a spotted point on a map, it’s a zoning.
Note: This is why I like the @Mattkmmr workaround. It conciliate both.
It seems all you want is not possible for the moment in the geography views. All the libraries you are speaking about are web site libraries. If you want to use them, the best way should be to write a web report including those libraries (leaflet, heatmap, folium based on javascript, cloropleth, …)
If you use matplotlib, you need at least 8MB of libraries and if you use cartopy, you needs also matplotlib, so the gramps package will grow aproximately 16MB for windows and mac users.
It’s difficult to add more libraries to gramps. the gramps package is already very big. (100MB for macs and 65MB for windows)
Linux is better managed for that.
matplotlib use its own maps.
cartopy can use some other maps (stamen, osm, google …), but I don’t know how to integrate it into the geography views with the osm-gps-map library. I needs to look at this.
Does 65 or even 100MB really an issue in 2020?
If Gramps includes python is there pip too? why not using pip to install needed libraries not included in gramps distribution while installing gramps or gramplets?
Perhaps for you it’s not a problem. Some people have old computers with small bandwith network, so it is a problem.
We already had a request for opencv which is very big, webkit which is also very big. If we accept all those libraries, gramps will be over 500MB. And I think we don’t want that.
The best way is to use Linux: gramps is only 6MB in size. All libraries are available and have no dependencies problem.
Why is there such a huge size difference between Windows/Mac and Linux?
I’ll try to create one.
@SNoiraud: I think we could even add it to Gramps without new dependencies if Gramps can render html pages as a gramps view. You only need the resulting html, CSS and JS. Once you have all that you only need to change the location data in the html to render the new map. A disadvantage of that solution is that you can’t change to different map tiles or do other configurations, but the heatmap should still work.
Gramps was originally developed for Linux, and depends on libraries that are commonly available there.
There are several ways that apps can be adapted to run under Windows; I think they all depend on recompiling for the specific tools and libraries of the ‘way’.
Due to MSoft, the Visual Studio compilers and associated libraries are one of the common ways of building apps. Unfortunately, the developer has to have those compilers (and at one time when I worked, my company paid big bucks to allow me access to those). I no longer have that access, and don’t feel like paying for it myself. But more importantly, no one who has attempted it has been able to successfully port Gramps to that environment. I’m not sure if it was lack of some critical library or what… Anaconda seems to be built this way.
The AIO uses the MSYS/MINGW environment which basically emulates Linux and as a result, can much more easily compile apps and libraries. There are still issues, particularly with Gtk which has to be tightly integrated into the Windows GUI APIs, but it pretty much works. But this doesn’t use the Visual Studio tools and is not compatible with libraries from those tools except in extremely limited situations.
If a user wants to install the MSYS/MINGW tools himself, and maintain it, he can also install Gramps and add whatever libraries he wants. It includes a shell that works much like the Linux command line and uses most of the same tools. For the rest of the more unsophisticated users, we create a ‘bundle’ of the necessary libraries and Gramps code and distribute that as the AIO with an installer.
The last potential way is to install a Linux subsystem for Windows, and then install Gramps on top of that. The GUI aspects are still a bit limited and have some issues, but I recall someone saying that he got Gramps working that way. When MSoft starts supporting GUI for Linux natively this will probably work better. I’m not clear on which compilers are used in this environment, so I cannot comment on compatibility with either of the other environements. Again, this is a bit more than the unsophisticated user is likely to want to do.